
How to Know If Users Love Your Product (Without Asking Them)
Can you measure love? When it comes to your app, absolutely. Think about it: no user is going to flat-out tell you “I adore this product!” But what if they’re showing you, in secret, every day? Your users are leaving clues. Every tap, swipe, and login is an unspoken confession. The real story lives in what they do, not what they say.
Facebook famously discovered that if a new user made 7 friends in 10 days, they were far more likely to stick around for the long haul. That’s behavioral proof of love. Likewise, if your product is truly adored, you’ll see the signs in your metrics: spiking retention, spontaneous word-of-mouth growth, users coming back for more. These are the heartbeats of an app people can’t live without.
So, user love is definitely measurable. It’s a mystery you can solve by watching where they flock and what they cling to. In this article, I will show you how to read those digital love letters your users are writing. Ready to play detective and find out if your users are truly in love?
Retention: Do They Keep Coming Back?
Retention is the love-o-meter. If users adore your app, they won’t be one-hit wonders; they’ll return again and again. Cohort retention measures the percentage of a group of new users (a cohort) that keeps using your product over time. Think of it as tracking how many first-time users fall in love and stick around. For example, a retention chart might show that after 30 days, only ~25% of a cohort is still active, which is actually common (most apps lose over 80% of new users in the first month). The flatter that retention curve gets (or the higher it stabilizes), the more your product has hooked its users.
Real-world example: Duolingo’s famous streak feature has 55% of users coming back the very next day to keep their streak alive, a phenomenal day-one retention rate. That habit-forming loop (gamified with points and streaks) signals true engagement. High retention means users aren’t just trying your app, they’re integrating it into their routine. As Y Combinator’s David Lieb puts it, “Cohort retention tracks the fraction of new users that come back time and time again to use your product.” In practice, if you see users returning week after week, you’ve likely built something that they want in their lives.
How to track it: Use analytics tools to set up retention cohorts and charts. Platforms like Mixpanel, Amplitude, and Firebase have built-in retention reports that let you see what percentage of users from each signup day or week are still active later. This helps you spot trends. E.g., if your onboarding improvements for users who joined in April led to better 7-day retention than users who joined in January. A steadily improving retention curve or a higher cohort percentage sticking around is a surefire signal of growing product love.
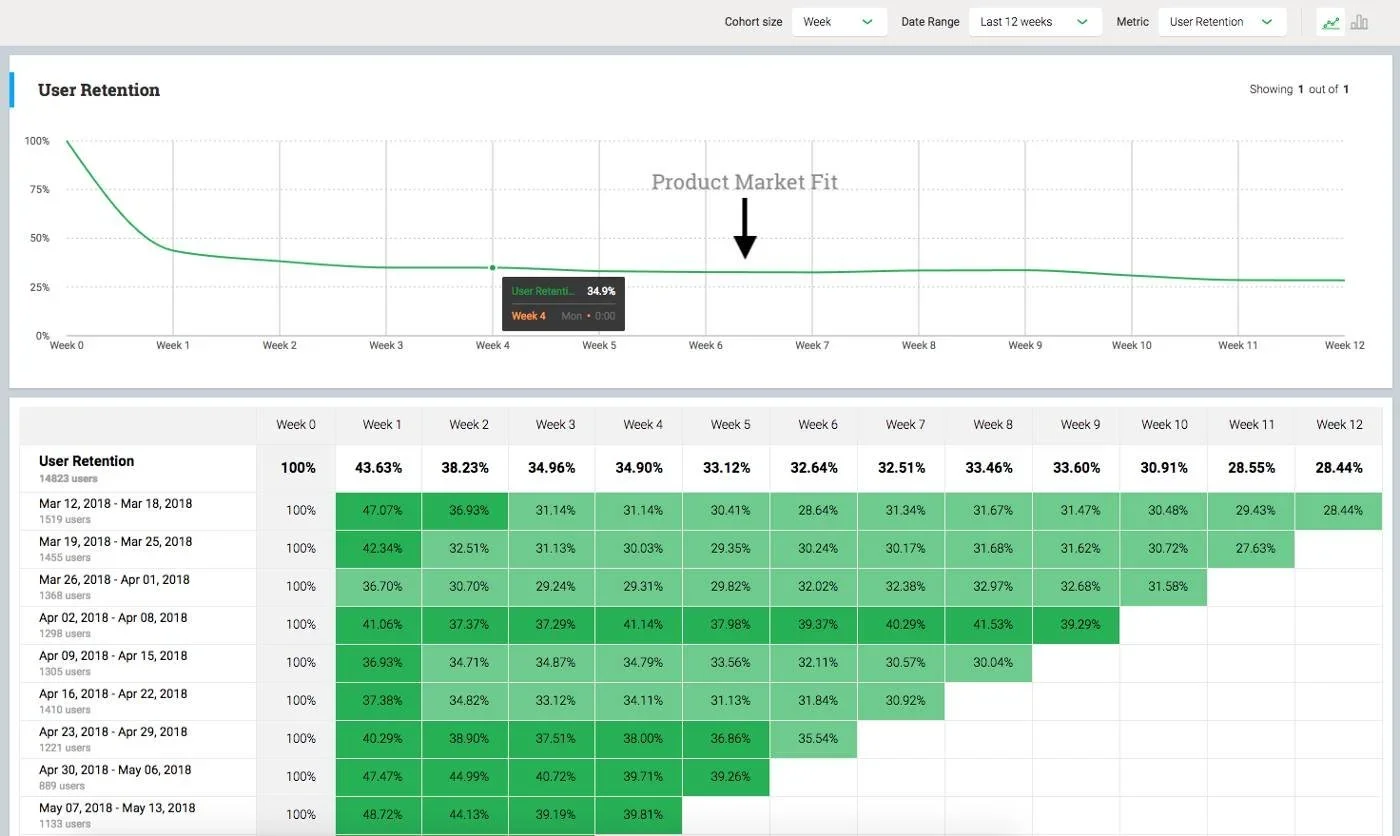
High Retention is the sign of love
Active Usage Frequency: Is Your App a Daily Habit?
Beyond raw retention, consider how frequently users log in. If they truly love your app, many won’t just come back eventually, they’ll come back constantly. This is where DAU, WAU, MAU come in: daily, weekly, and monthly active users. The king here is stickiness, often measured by the DAU/MAU ratio: what fraction of your monthly users use the product in a typical day. A higher ratio means your product is habit-forming. Facebook famously achieved 60% stickiness (meaning over half of all monthly users were on every day), the kind of number that signals an indispensable product.
For a startup example, Duolingo boasts 34M daily active users vs. 103M monthly users. That’s roughly a one-in-three chance any given user is active on a given day – impressive for a learning app! It suggests a large chunk of their audience has made Duolingo practice a daily routine. Similarly, Instagram hasn’t publicly disclosed DAU lately, but considering it has 2+ billion MAU and anecdotally heavy daily usage, it’s clear many people treat Instagram as a daily habit. In fact, Instagram’s Stories feature alone has 500 million daily users – meaning a huge cohort uses it every single day. If your app can achieve that kind of frequent engagement, even on a smaller scale, you’re in loved-product territory.
How to track it: Monitor your DAU, WAU, and MAU counts and ratios. Analytics dashboards (Amplitude, etc.) can chart daily active trends and calculate stickiness for you. Look at the DAU/MAU ratio. E.g., 50% means users on average use the app 15 days a month, whereas 20% might indicate it’s more of a weekly-use tool. Also compare week-to-week and month-to-month growth in active users. Are daily actives increasing alongside total users? A growing base of daily loyalists is a powerful signal that users find real, recurring value in your product.
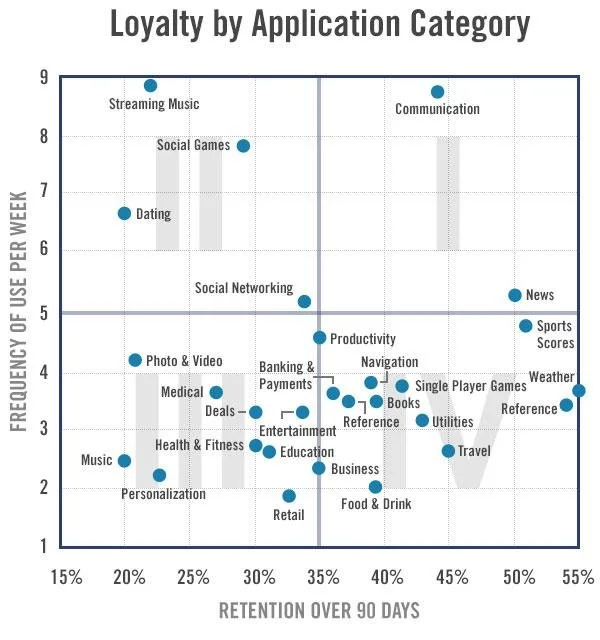
App Engagement by Flurry Analytics
Session Length & Depth: They Can’t Put It Down
Time = Love in the app world. Session length shows how long users spend per visit, and overall daily time spent indicate how engaged and delighted they are. If users routinely spend significant time in your app, that’s a strong sign it delivers value or enjoyment they don’t want to leave. E.g., Instagram users spend about 33 minutes per day on average, scrolling and tapping through content. That’s 33 minutes of undivided attention (an eternity in internet time :) ), and it shows how captivating the experience is. TikTok’s number is even higher, which is one reason it’s seen as so addictive.
Of course, “longer is better” isn’t universal. An utility app that solves a problem quickly can still be beloved. But generally, if your goal is engagement, increasing session length and depth of interaction are positive signals. An education app like Duolingo manages to get users to spend ~15 minutes a day learning, which is huge for an ed-tech product, proof that its gamified lessons have users hooked. Notion, a productivity app, became so integral to workflows that users started spending hours organizing their lives in it, to the point that Notion has been called “one of the most loved” productivity tools online. When users willingly devote more of their precious time to your app, it’s a clear indicator of love.
How to track it: Look at metrics like average session length, total minutes per user per day, and number of sessions per day. Firebase and Amplitude can show you average engagement time. If you see session lengths growing or a cohort of power users spending exorbitant time in the app, that’s a big green flag. Also pay attention to what users do in those sessions: are they exploring many features or just one thing? Deep, exploratory usage means they’re getting value. And if you have a content app, metrics like scroll depth or video watch time can reveal how compelling users find your content. E.g. watching 90% of a video vs. dropping off after 10%. The more glued to the screen users are, the more affection they likely have for your product.
Core Feature Usage
Do users come back for the core experience again and again? One strong signal of love is repeat feature usage: users continuously using the feature that delivers your app’s main value. If you’re a photo-sharing app and people are obsessively posting and viewing photos daily, that’s love. If you’re Duolingo and users relentlessly do lessons to maintain streaks, that’s love. If you’re Notion and users create new pages every week to organize new parts of their life, that’s love. Essentially, look for the patterns: are users repeatedly engaging with the key action that your app is built around?
For example, Slack discovered that teams which exchanged a certain number of messages early on (~2,000 messages in the first month) were far more likely to stick around long-term. Hitting that threshold was an aha moment indicating the team had found lasting value in Slack. It makes sense: if a team sends thousands of messages, it means Slack has become their primary communication channel, they love it enough to practically live in it. Likewise, consider Instagram’s core features: posting, liking, commenting, messaging. High frequency of those actions demonstrates that the product has woven into their daily social fabric.
To spot this, define what your app’s North Star action is: the key thing that a loving user does often. It might be completing a workout (if you’re a fitness app), or creating a to-do item (if you’re a productivity app), or sharing a file (if you’re a collaboration tool). Then track how often users perform that action and how many users do it repeatedly. If you notice that power users aren’t just active, but are performing the core action over and over, you’ve struck gold.
How to track it: Event analytics are your friend here. With tools like Mixpanel or Amplitude, instrument the core events (e.g. “Posted photo”, “Completed lesson”, “Created note”) and then look at counts per user, or how many users perform it X times. Funnel analyses can also help: do users come back and complete that action again? If say 50% of users who create one playlist in your music app go on to create 5+ playlists within a month, you’re seeing repeat engagement with the core feature. That’s a sign of genuine product love, users are not only trying the main feature, they’re incorporating it into their routine regularly.
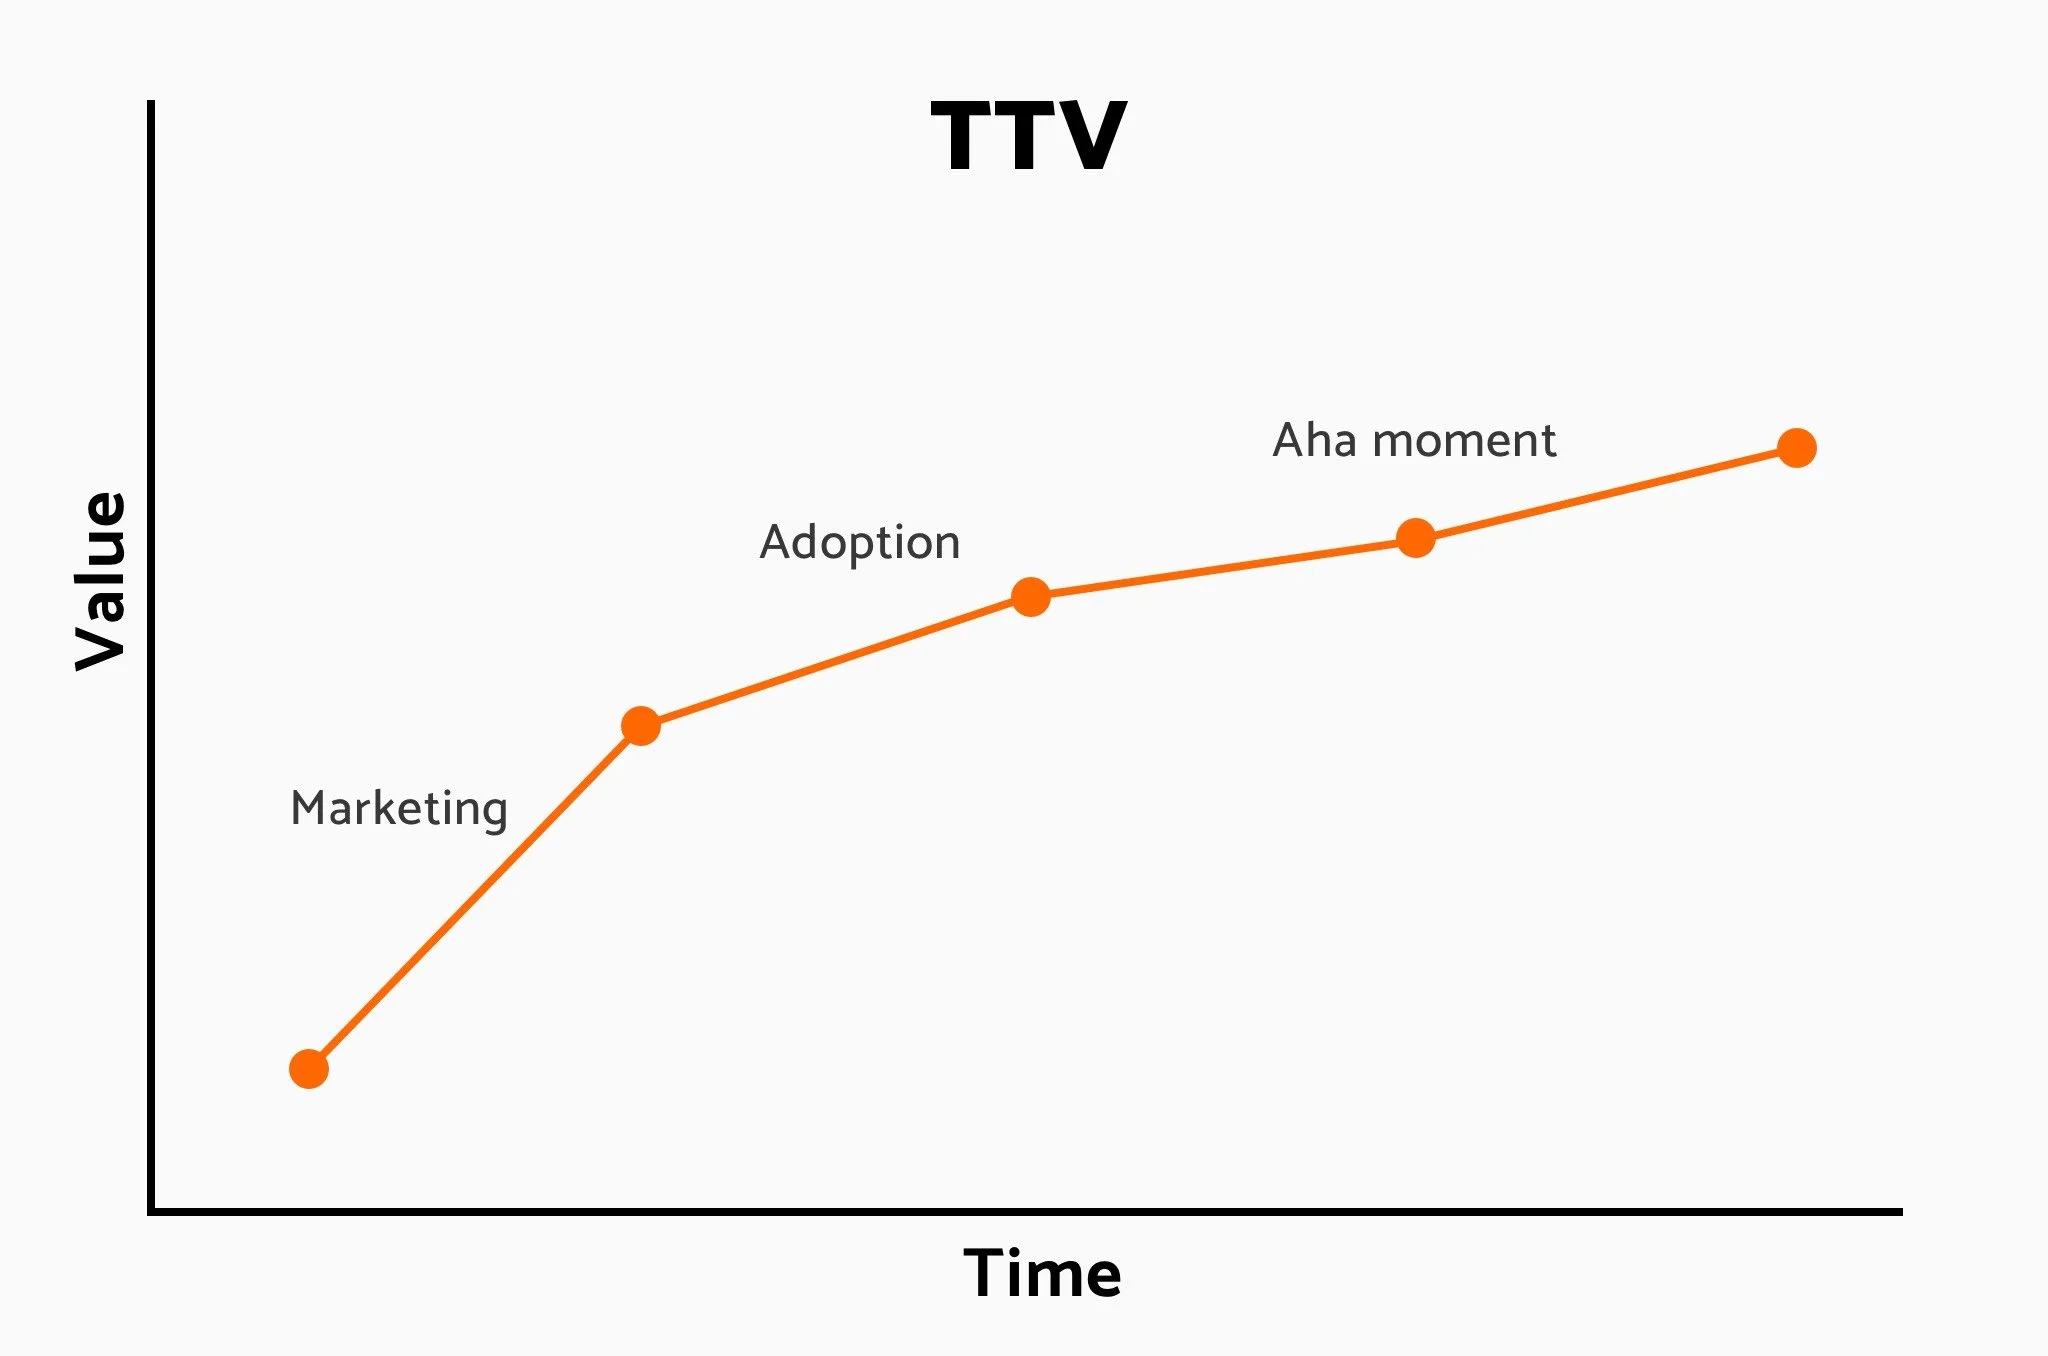
Time to Value
How quickly do new users get value from your app? If users fall in love, it often starts with an “aha!” moment early on. Time to Value (TTV) is the metric that tracks how long it takes a new user to reach that moment of truth where the product’s value clicks. A short TTV means users experience the magic almost immediately, which greatly increases the chance they’ll stick around. After all, if your app takes too long to show its value, many users will wander off before they ever fall in love.
A classic example comes from Facebook’s early days: they noticed that users who added at least 7 friends in their first 10 days were far more likely to become long-term active users. Those 7 friends constituted an “aha moment”: after that, Facebook made sense and became socially engaging. Twitter has a similar story about requiring a certain number of follows to make the feed come alive. These were early activation metrics that correlated with retention: users who hit those milestones were effectively saying “I’ve seen the value and I’m here for it.” In product terms, they fell in love quickly.
For your app, identify what action or milestone best represents initial value. It could be completing a first task, filling out a profile, making a first transaction, or connecting with another user. Then measure how soon or how often new users reach that point. If you can get a user to the “wow, this is useful!” moment in a few minutes or hours instead of days, you’re speeding up the path to love. And if a large percentage of users do achieve that in short order, you’re doing great. Conversely, if your analytics show most users drop off before ever hitting a key activation step, it’s a sign you’re not yet delivering value fast enough.
How to track it: Funnel analysis and cohort tracking will help. Set up a funnel from sign-up to that key action (e.g. Sign up -> complete onboarding tutorial -> play first song -> add 3 friends). Measure the median time it takes for users to get there, or the percentage who do it within 1 day, 7 days, etc. Cohort retention comes into play here too: users who hit the aha moment should have markedly higher retention than those who don’t. If you find that magic correlation, like “users who create a project within 24 hours retain 2x better than those who don’t”, you’ve uncovered a pivotal love signal. Optimize to get more people to that point faster. Use onboarding nudges, tooltips, emails, whatever it takes to shorten TTV. A quick payoff not only delights users early but sets the hook for long-term love.
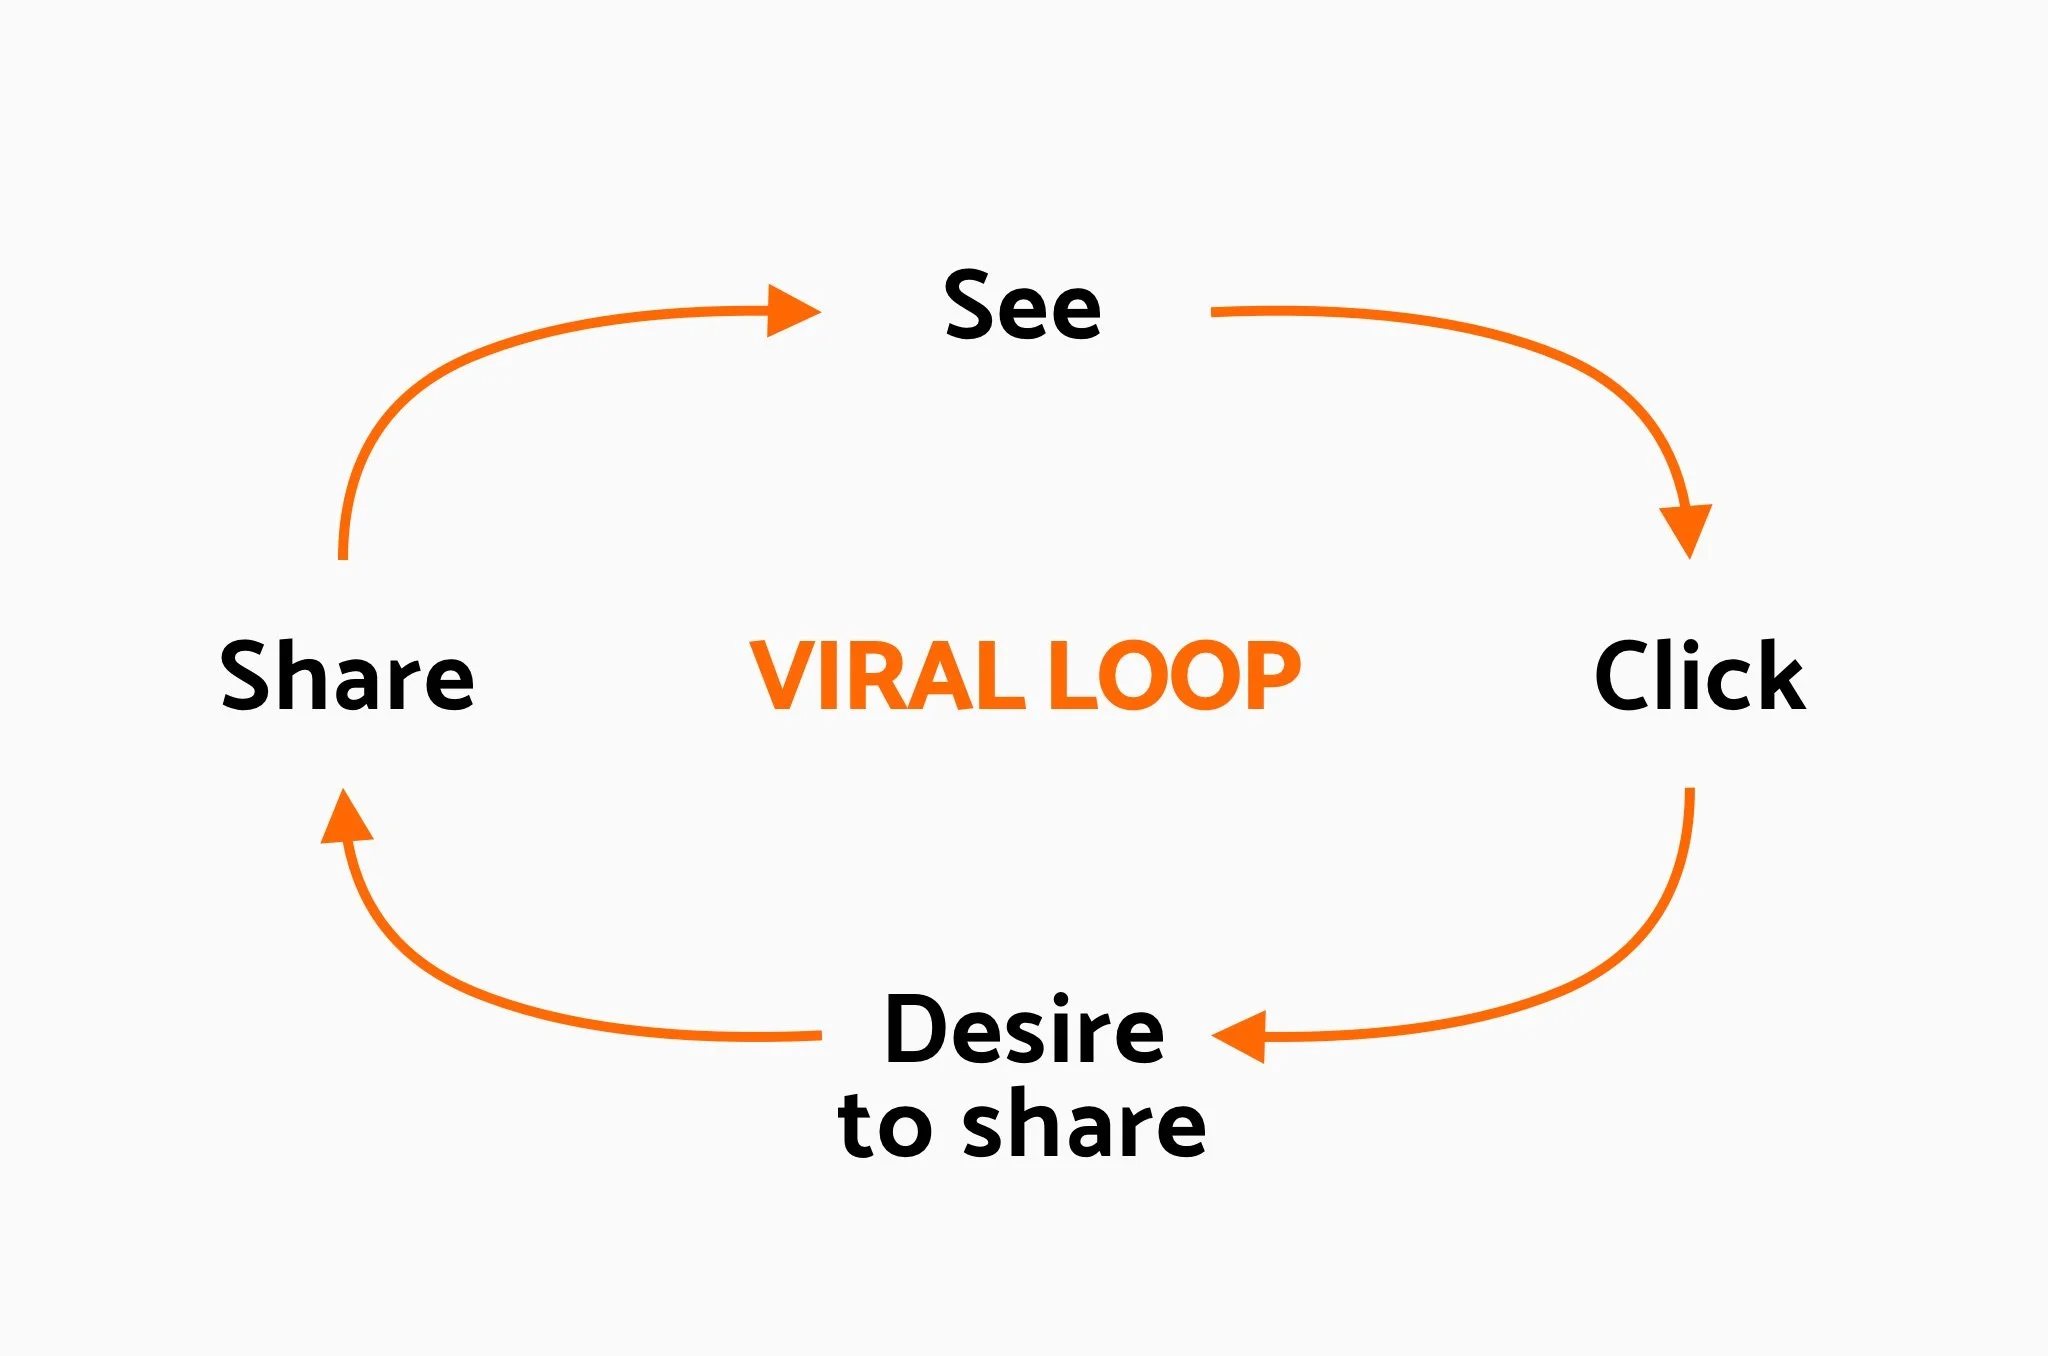
Shareability & Referrals: Are They Spreading the Love?
Perhaps the strongest sign of all: users love your product so much they can’t help telling others. If you see organic growth, invites sent, or referral links being used frequently, that’s users saying “you’ve got to try this” without being prompted – the ultimate compliment. Word-of-mouth was instrumental for many breakout apps. Duolingo, for example, has disclosed that about 80% of its users were acquired organically, via social media or word-of-mouth. That means an existing user loved it enough to recommend it, or share their progress, and pulled in new users for free. That kind of unsolicited evangelism is gold.
Look at Instagram’s growth in its early years, largely driven by people sharing photos to Facebook or telling friends to join so they could follow each other. Or Notion’s rise, fueled by communities sharing templates and enthusiasts raving about it on Twitter and Reddit. Notion’s subreddit swelled to hundreds of thousands of members, far surpassing its older competitors – a sign that users weren’t just using the product, they were forming communities around it. When users create content around your product (like YouTube tutorials, forum discussions, meme accounts), you’ve transcended utility and entered the realm of affection.
How to track it: Most apps have some built-in mechanisms for sharing or inviting. Track metrics like invite conversions (how many invites sent vs. accepted), referral traffic, or use of share features. For instance, if your app has a “Share with a friend” or content-sharing option, see what percentage of users use it, and how often. If a significant chunk of your growth is coming from referrals rather than paid acquisition, it’s a strong signal of product love. Users are effectively doing your marketing for you because they genuinely want others to experience it. You can also use Net Promoter Score (NPS) surveys to gauge willingness to recommend, but those do involve asking. The beauty of measuring referrals is that it captures what users actually do. High referral rates or viral growth loops indicate you’ve built something so good that users can’t keep it to themselves.
Analytics: Your Secret Weapon
All these signals – retention, active use, session time, feature hits, referrals – come from user behavior data. Setting up and monitoring this data is one of the smartest moves a founder can make. The good news: you don’t need a PhD in data science or a huge team to do it. Modern product analytics tools are like secret weapons for founders, turning raw app events into clarity. Mixpanel and Amplitude are two popular choices that offer user-friendly dashboards for startups. These tools often come with templates for cohort retention, funnels, and engagement, so you can plug them in and start getting insights right away.
Firebase Analytics is another powerful tool, especially for mobile apps. It’s free and provides real-time analytics, including retention cohorts, engagement time, and even notifications integration. For example, Firebase’s cohort analysis can visualize what percentage of users you retain over days and weeks and help pinpoint where folks drop off. This can guide you on when to send a well-timed push notification or offer to re-engage users. But use that sparingly, you want to show love, not desperation!
The key is to instrument your app with events that map to the signals we’ve discussed. Define events for sign-up, key actions, shares, etc., and set user properties if needed (e.g. plan type, cohort ID). Then use these tools to watch the trends. It’s not just about collecting data for data’s sake. It’s about focusing on the metrics that matter for love. Successful startups pick a focus metric aligned to product-market fit and track it fanatically. Your focus metric might be retention, or WAU growth, or something custom like “streaks completed.” Use analytics to keep a pulse on it. When numbers move, dig in to understand why, maybe a new feature increased session length or a bug hurt retention. This practice turns analytics into a founder’s compass rather than a swamp of numbers. With the right metrics in hand, you can iterate your way to a product users can’t live without.
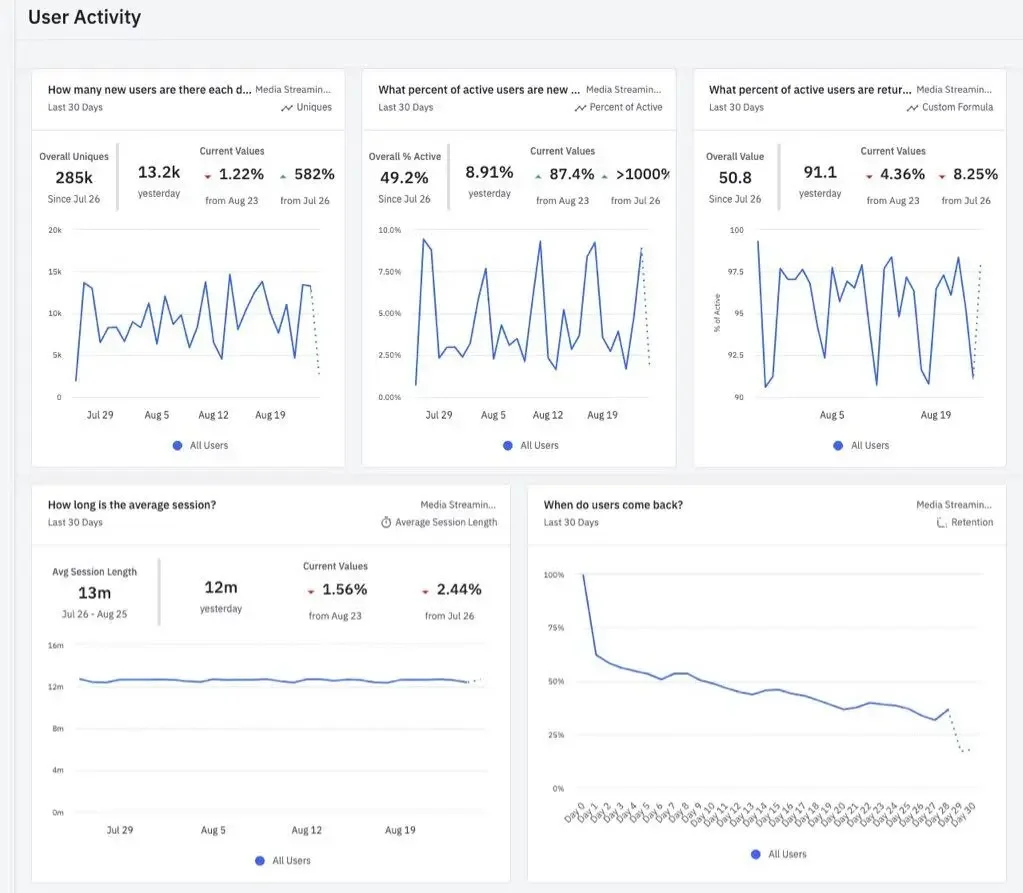
Analytics dashboard example
The Product Love Checklist
Here’s a simple checklist for spotting true product love in your mobile app. Use this as a founder-friendly guide to keep tabs on the health and affection of your user base:
Cohort Retention: Are a healthy percentage of users sticking around after each of the first days, weeks, and month? Aim for that retention curve to flatten out, not plummet to zero. Improving cohort retention over time is a great sign.
DAU/WAU/MAU Ratio: Do users come back frequently (daily or multiple times a week)? A high DAU/MAU means your app is part of their routine, not a one-off tool.
Session Duration & Frequency: Are users spending significant time in the app and coming back multiple times a day? Long, engrossed sessions (e.g. 30+ min/day on Instagram on average) indicate strong engagement.
Core Feature Usage: Do users repeatedly use your app’s primary feature? Identify your North Star action and check repeat usage. If users are performing it over and over (like sending thousands of messages, completing many courses, etc.), they’re finding continuous value.
Time to Value (Activation): How quickly do new users get to the “aha moment”? Track if they hit key milestones early (e.g. completed onboarding or first key action). Fast activation correlates with higher love and retention.
Referral and Sharing: Are users promoting the app for you? Monitor invites sent, referral sign-ups, and content shares. Heavy organic growth or 80%+ organic sign-ups mean users are enthusiastically spreading the word, so they must really love it!
Indirect User Feedback: Even without asking directly, look for signs of love in reviews, social media, and community forums. Are users creating content (guides, memes, fan communities) around your app? A passionate user community is a gold-star indicator.
Lastly, keep using your analytics toolkit to gather these insights. The checklist above isn’t one-and-done, make it a habit to review these metrics regularly. When most of these signals are flashing green, congratulations: users don’t just like your product, they love it ❤️