

our expertise
Available for everyone
Our team has a vast experience with startups and VC. Some of our teammates have come from software development services. This fusion of expertise and experience lets us masterfully solve real client’s issues.
Here are some key points that you should focus on in your startup. These are the points we help our clients to focus on.
Table of content:
1. Product/Market Fit
2. Innovative products' consumers
3. Agile
4. Lean Startup Methodology
5. Hockey Stick
Product/Market Fit
Product/market fit it's being in a good market with a product that can satisfy that market. Simply put, it means: people want your stuff.
On the chart you can see 5 stages that companies go through: Empathy, Stickiness, Virality, Revenue and Scale. You can't scale your business until you are sure that the first 3 stages are completed.

A little bit in details about each stage:
1) Empathy — I’ve found a real, poorly-met need a reachable market faces. And I’ve figured out how to solve the problem in a way they will adopt and pay for it.
2) Stickiness — I’ve built the right product that keeps users around.
3) Virality — Users base growth organically and artificially.
4) Revenue — I’ve found a sustainable, scalable business with the right margins in a healthy ecosystem.
5) Scale — I can achieve a successful exit for the right terms.
The first three stages are the most important part for startups. This is that part that Steve Blank called "Customer Development".
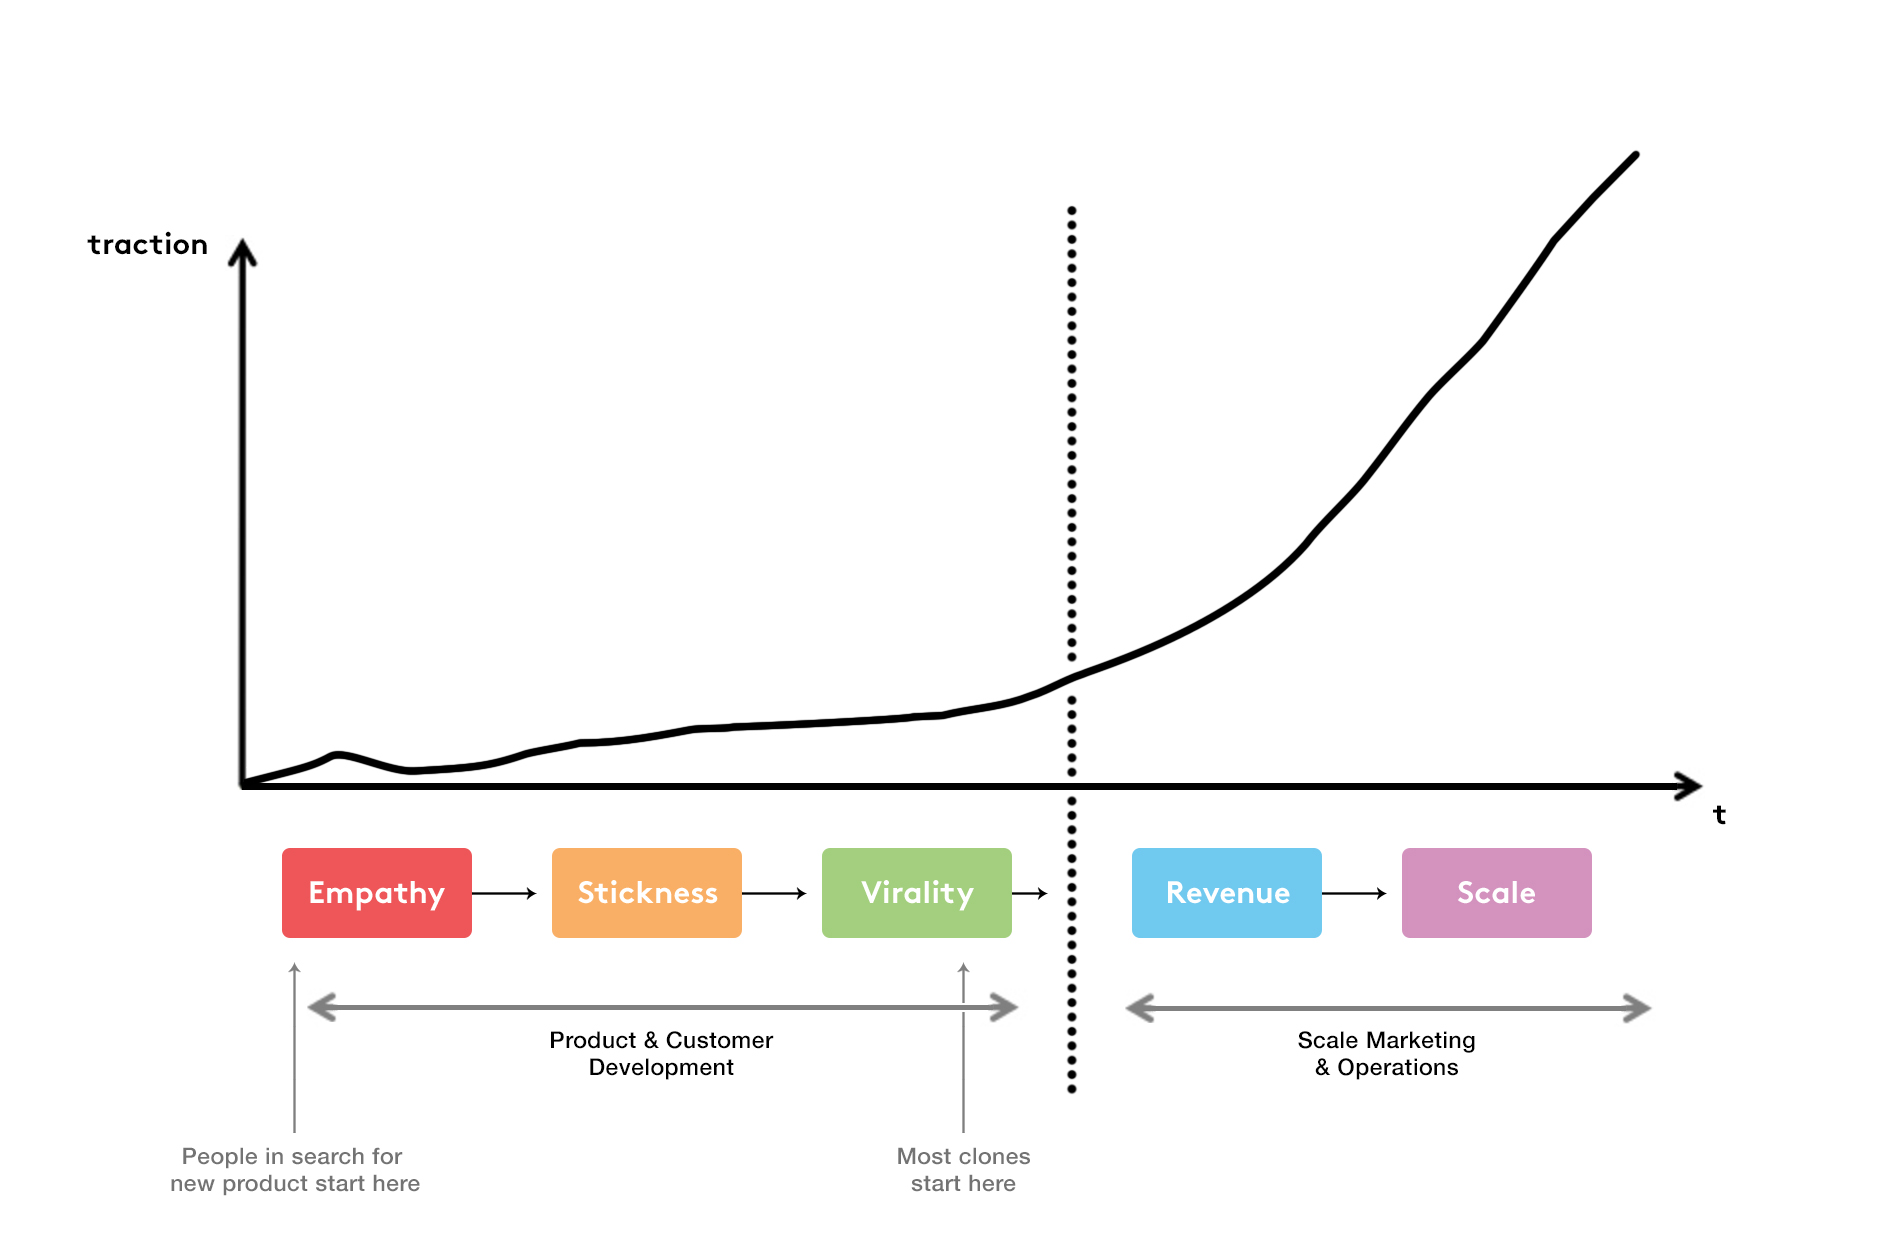
Most of the techniques/pattern that you can find came out from Online Marketing: A/B Testing, Funnels, Referral Optimization, etc. They are about optimizing, not innovating. So, don’t look for how to scale your startup. Look for customers and their needs.

Consumers of Innovative Products
Groups are distinguished from each other based on their characteristic response to discontinuous innovations created by new technology.
Innovators (2.5%) – Those who are first to adopt new innovations are simply referred to as "Innovators". Innovators are willing to take risks; the youngest in age; have the highest social class; have great financial lucidity; are very social; and have the closest contact to scientific sources and interaction with other innovators. Risk tolerance makes them adopt technologies which may ultimately fail. Financial resources help absorb these failures.
Early Adopters (13.5%) – This is the second fastest category of individuals who adopt an innovation. These individuals have the highest degree of opinion leadership among the other adopter categories. Early adopters are typically younger in age; have a higher social status, have more financial lucidity, advanced education, and are more socially forward than late adopters. More discrete in adoption choices than innovators. Realize judicious choice of adoption will help them maintain central communication position.
Early Majority (34%) – Individuals in this category adopt an innovation after a varying degree of time. This time of adoption is significantly longer than the innovators and early adopters. Early Majority tend to be slower in the adoption process; have above average social status; contact with early adopters; and seldom hold positions of opinion leadership in a system.
Late Majority (34%) – Individuals in this category will adopt an innovation after the average member of the society. These individuals approach an innovation with a high degree of skepticism and after the majority of society has adopted the innovation. Late Majority are typically skeptical about an innovation, have below average social status, very little financial lucidity, are in contact with others in late majority and early majority, have very little opinion leadership.
Laggards (16%) – Individuals in this category are the last to adopt an innovation. Unlike some of the previous categories, individuals in this category show little to no opinion leadership. These individuals typically have an aversion to change-agents and tend to be advanced in age. Laggards typically tend to be focused on “traditions”, are likely to have lowest social status, lowest financial fluidity, be the oldest of all other adopters, are in contact with only family and close friends, and have very little to no opinion leadership.

Let's place it all to a one chart. We will take something like this:

With titles:

Let's clean it up a little bit. Now we have chart separated by 5 segments. Each segment - different type of customers. It's classical chart of Technology Adoption Life Cycle. But here is a moment. This chart is an "ideal model".

In real life here is a gap or "chasm" between the first two adopter groups and majority. Visionaries and pragmatists have very different expectations, and exploring these differences is very important. By identifying these differences you will be able to suggest techniques to successfully cross the "chasm," including choosing a target market, understanding the whole product concept, positioning the product, building a marketing strategy, choosing the most appropriate distribution channel, pricing and so on.

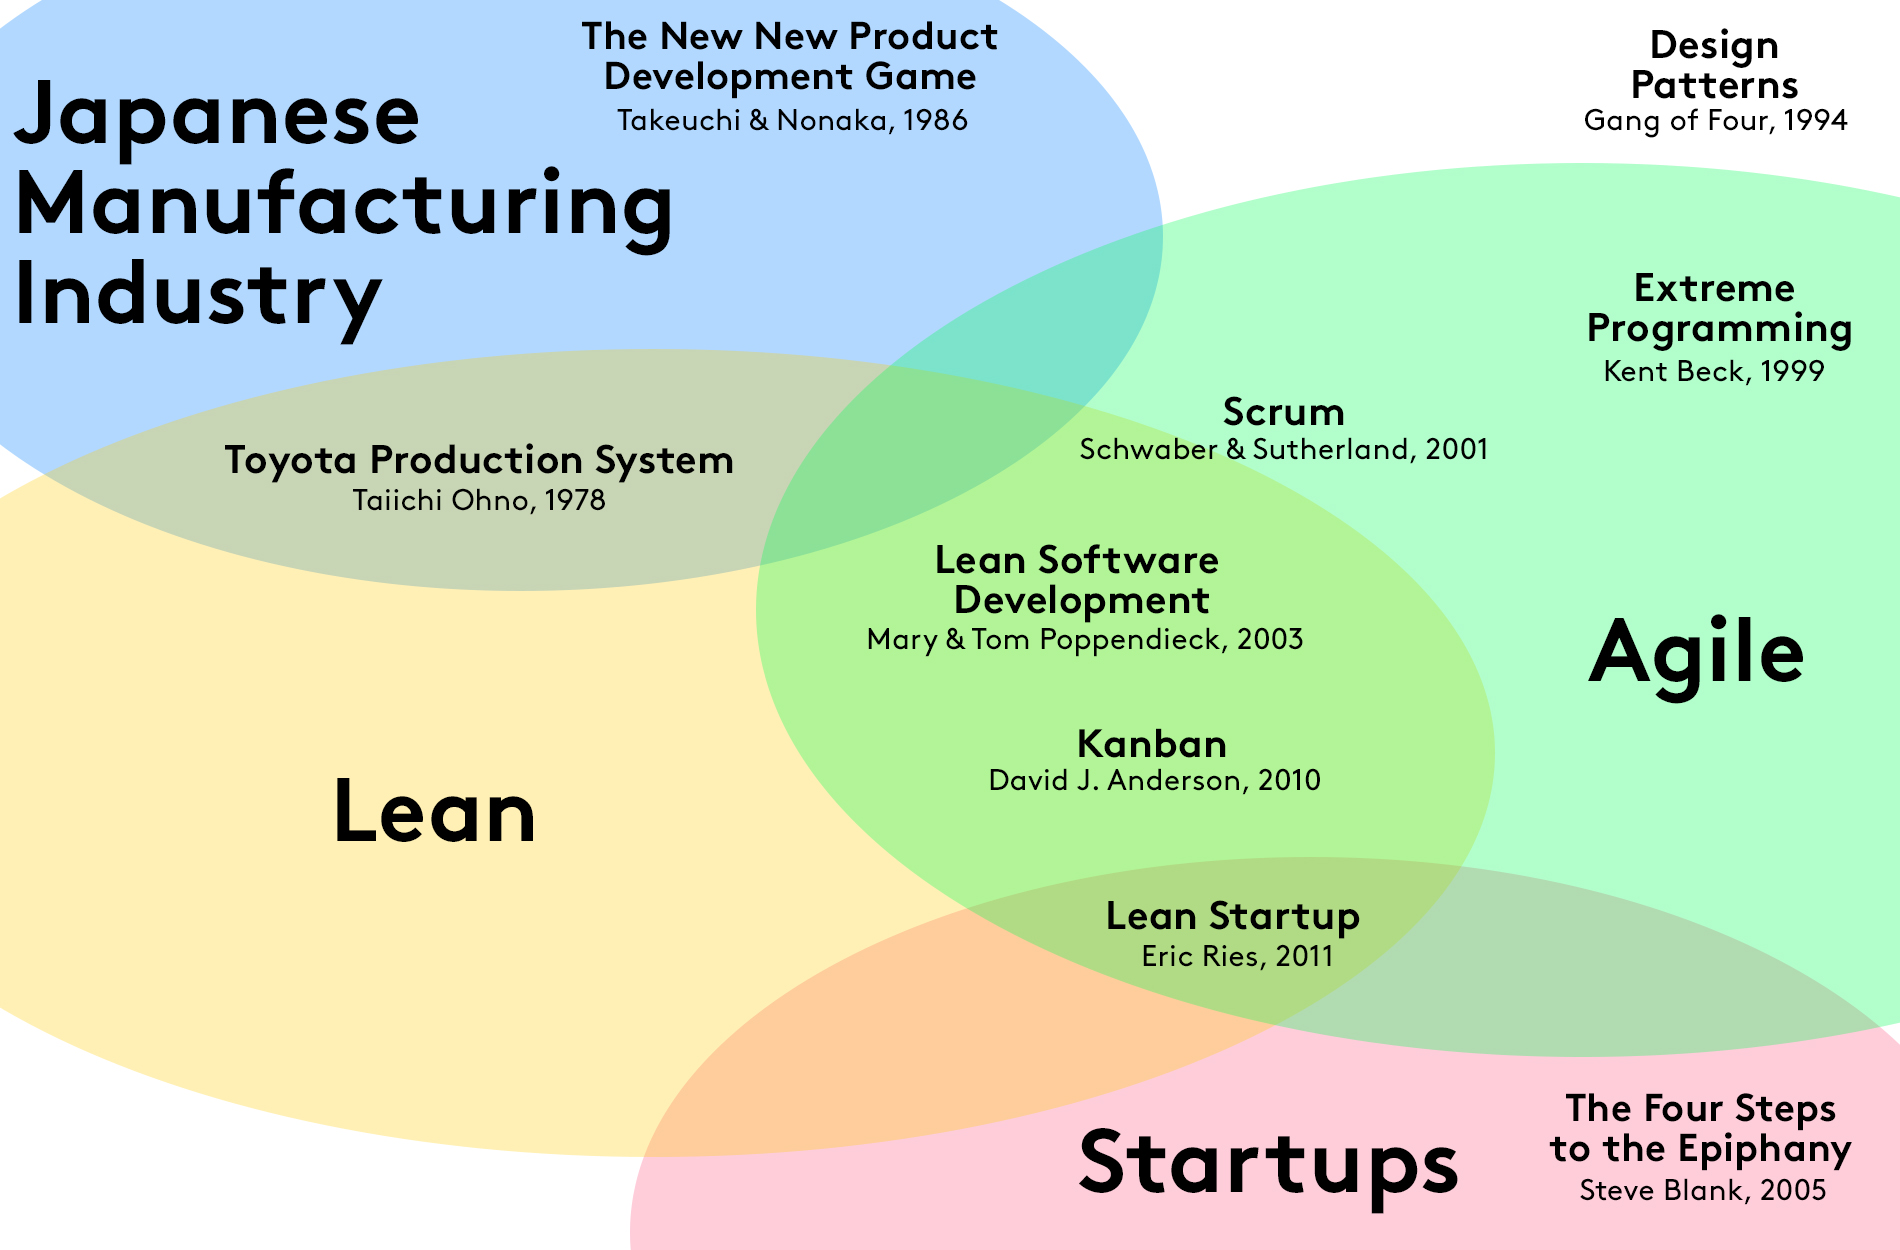
Agile
Yeah, nearly all software development companies write, that they work with Agile, dealing with "Sprints", "backlogs", "tickets", etc. But, sometimes it doesn't help. We deeply believe that Agile is the minimum necessary for startups but is an insufficient method. Only working tightly with Lean Startups Methodology, it can give a result in a startup's conditions of uncertainty.
On the scheme below you can see how modern methodologies intersect, and (the main point!) where is startups on it.
Lean Startup Methodology
The Lean Startup provides a scientific approach to create and manage startups and get a desired product to customers' hands faster. The Lean Startup is how to drive a startup, how to steer, when to turn, when to persevere, and grow a business with maximum acceleration.
Too many startups begin with an idea for a product that they think people want. They then spend months/years, perfecting that product without ever showing the product, even in a very rudimentary form, to the prospective customer. When they fail to reach broad uptake from customers, it is often because they never spoke to prospective customers to determine whether or not the product was interesting.
The Lean Startup methodology has as a premise that every startup is a grand experiment that attempts to answer a question. The question is not "Can this product be built?" Instead, the questions are "Should this product be built?" and "Can we build a sustainable business around this set of products and services?". Such experiment is more than just theoretical inquiry; it is a first product. If it is successful, it allows to get started with campaign: enlisting early adopters, adding employees to each further experiment or iteration, and eventually starting to build a product. By the time when product is ready to be distributed widely, it will already have established customers. It will solve real problems and offer detailed specifications for what needs to be built.
The fundamental activity of a startup is to turn ideas into products, measure how customers respond, and then learn whether to pivot or persevere. That's why a core component of Lean Startup methodology is the build-measure-learn loop:
- figuring out the problem that needs to be solved;
- developing MVP to begin the process of learning as quickly as possible;
- learn customers' feedback.
Once the MVP is established, a startup can work on tuning the engine. This will involve measurement and learning and must include actionable metrics that can demonstrate cause and effect question.

Hockey Stick
Usually a company's life cycle is visualized like hockey stick chart. This chart describes the costs and profits of a product from the technological development phase, to market maturity, to eventual decline. Research and development (R&D) costs must be offset by profits once a product comes to market. Varying product lifespans means that businesses must understand and accurately project returns on their R&D investments based on potential product longevity on the market. Classical chart looks like this:

But in real life it looks like this:

All life cycles has four distinct stages: R&D, Ascent, Maturity, and Decline.
Research and Development (aka R&D) - During this stage, risks are taken to invest in technological innovations. During this period a company hires engineers, registers intellectual property and works toward the first versions of a product.
Ascent Phase - This phase covers the timeframe from product invention to the point at which out-of-pocket costs are fully recovered. At this junction, the goal is to see the rapid growth and distribution of the invention and leverage the competitive advantage of having the newest and most effective product.
Maturity Stage - As the new innovation becomes accepted by the general population and competitors enter the market, supply begins to outstrip demand. During this stage, returns begin to slow as the concept becomes normalized.
Decline Phase - The final phase is when the utility and potential value to be captured in producing and selling the product begins dipping. This decline eventually reaches the point of a zero-sum game, where margins are no longer procured.
Full cycle looks like this:

Notice, where the place of startups is. That's why after rapid growth, an IPO is made for the startup. If you are interested in more about investments in a company's life cycle, this chart is for you:

Also for you


If you still have any questions - feel free to contact us.